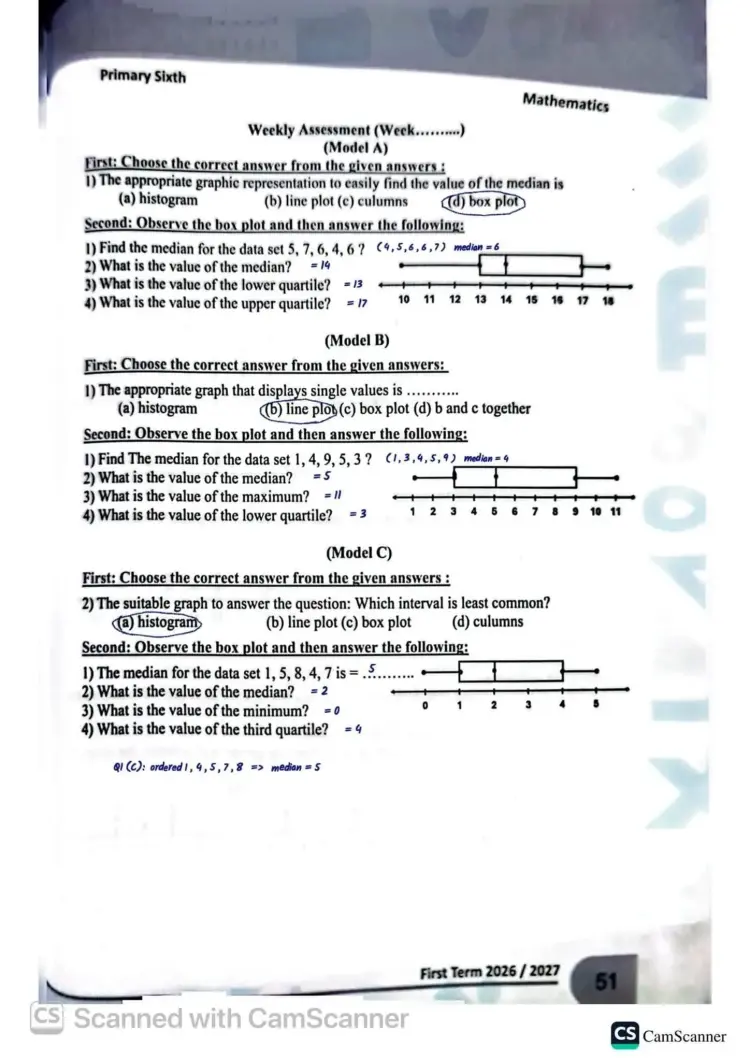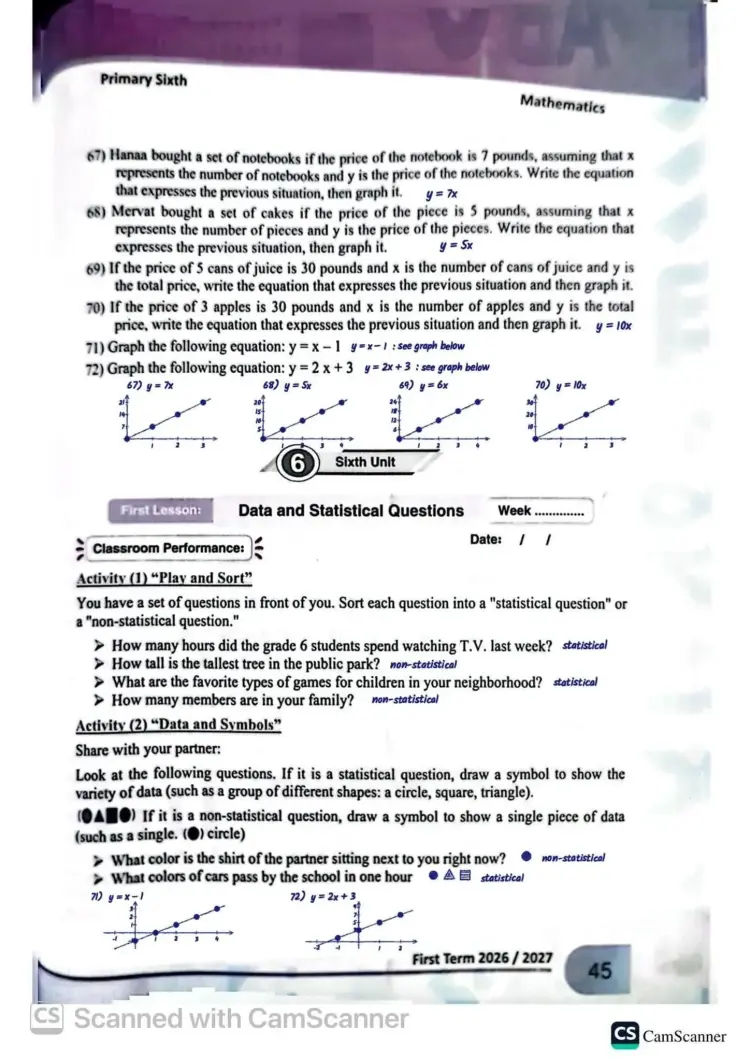
حل الوحدة السادسة Math للصف السادس الابتدائي الترم الأول 2027
حل الوحدة السادسة Math للصف السادس الابتدائي الترم الأول 2027
يبحث الطلاب وأوياء الأمور عن حل الوحدة السادسة Math للصف السادس الابتدائي الترم الأول 2027، وذلك بالتزامن مع استعداد الطلاب لأداء امتحانات شهر نوفمبر.
حل الوحدة السادسة Math للصف السادس الابتدائي الترم الأول 2027
وفيما يلي حل الوحدة السادسة Math للصف السادس الابتدائي الترم الأول 2027، والتي جاءت كما يلي
-
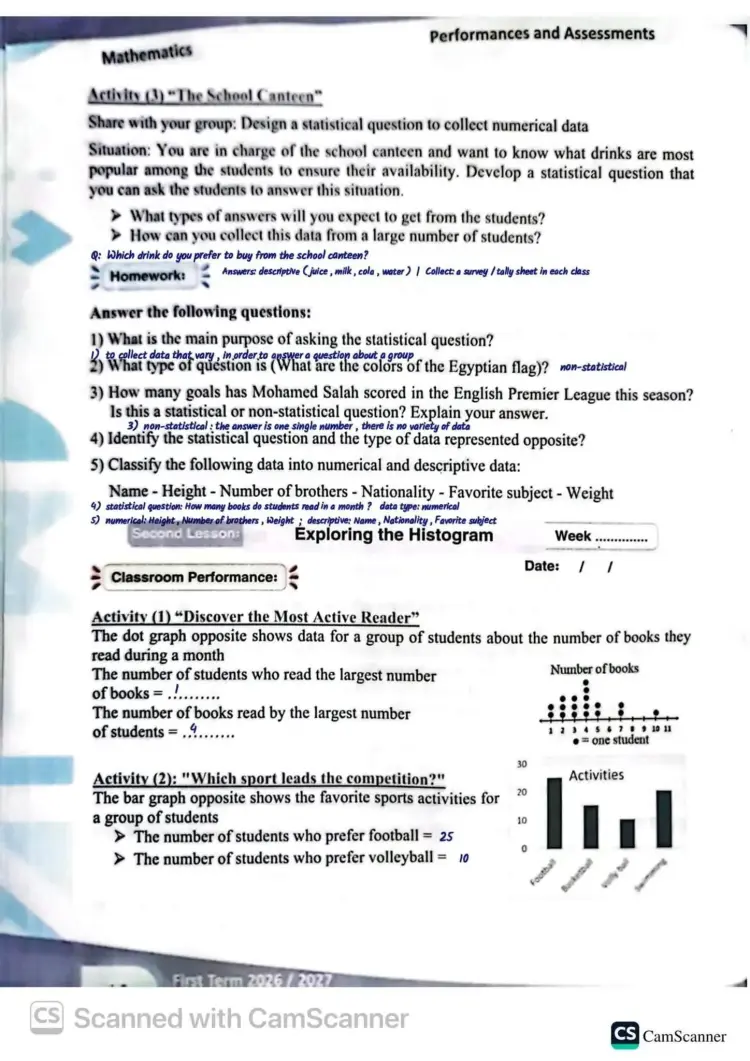
Activity (3) "The School Canteen"
-
Share with your group: Design a statistical question to collect numerical data.
-
Situation: You are in charge of the school canteen and want to know what drinks are most popular among the students to ensure their availability. Develop a statistical question that you can ask the students to answer this situation.
-
What types of answers will you expect to get from the students?
-
How can you collect this data from a large number of students?
-
-
Q: Which drink do you prefer to buy from the school canteen?
-
Answers: descriptive (juice, milk, cola, water) | Collect: a survey / tally sheet in each class.
-
-
Homework:
-
Answer the following questions:
-
What is the main purpose of asking the statistical question?
- To collect data that vary, in order to answer a question about a group.
What type of question is (What are the colors of the Egyptian flag)?
- To collect data that vary, in order to answer a question about a group.
-
- non-statistical.
How many goals has Mohamed Salah scored in the English Premier League this season? Is this a statistical or non-statistical question? Explain your answer.
- non-statistical.
-
- non-statistical; the answer is one single number, there is no variety of data.
Identify the statistical question and the type of data represented opposite?
- non-statistical; the answer is one single number, there is no variety of data.
-
- statistical question: How many books do students read in a month? | data type: numerical.
Classify the following data into numerical and descriptive data:
- statistical question: How many books do students read in a month? | data type: numerical.
-
-
Name - Height - Number of brothers - Nationality - Favorite subject - Weight
- numerical: Height, Number of brothers, Weight | descriptive: Name, Nationality, Favorite subject.
Second Lesson: Exploring the Histogram
-
-
-
-
-
Classroom Performance:
-
Activity (1) "Discover the Most Active Reader"
-
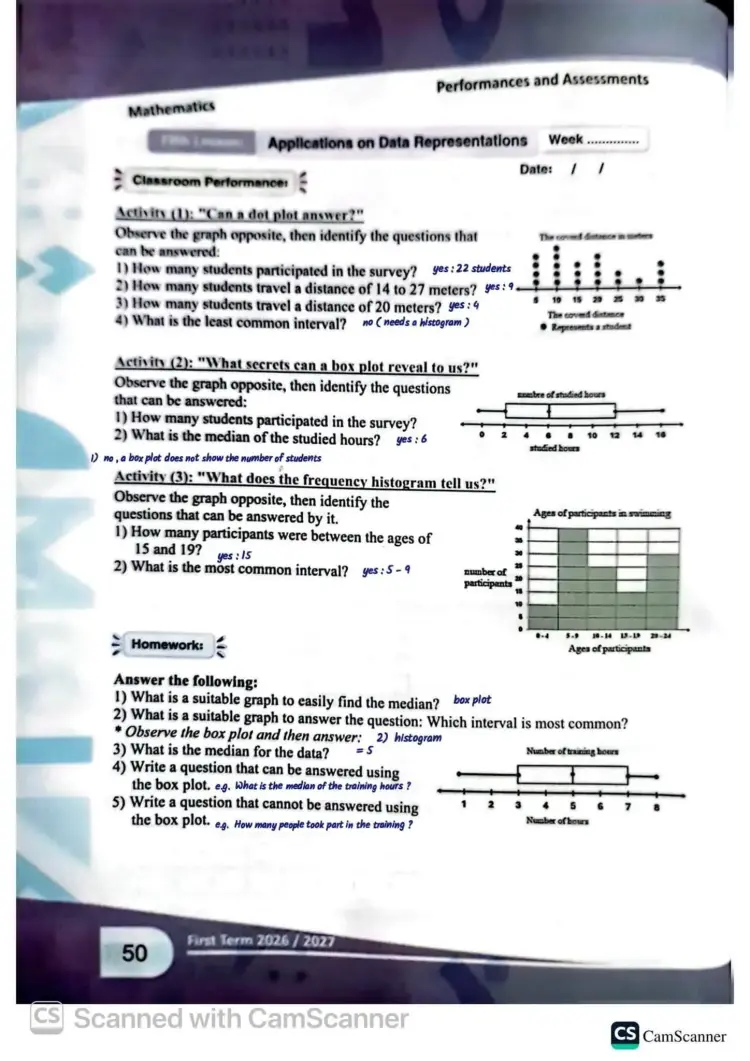
The dot graph opposite shows data for a group of students about the number of books they read during a month.
- The number of students who read the largest number of books = 1.
The number of books read by the largest number of students = 4.
Activity (2) "Which sport leads the competition?"
-
-
-
The bar graph opposite shows the favorite sports activities for a group of students:
- The number of students who prefer football = 25.
The number of students who prefer volleyball = 10.
تفريغ الصفحة الثانية (صورة رقم 4 - ص 47)
- The number of students who prefer football = 25.
-
-
-
-
Primary Sixth - Mathematics
-
Activity (3): "Who studies the most?"
-
Observe the graph opposite and then complete:
- The graph opposite is called histogram.
Number of students who study 6 hours or more = 12 + 2 = 14.
The vertical axis represents the number of students.
Homework:
- The graph opposite is called histogram.
-
-
-
-
- histogram
dot plot (line plot)
Answer the following:
- histogram
-
-
Which graph shows numerical data grouped into intervals?
-
Which graph includes data shown above the number line?
-
From the graph opposite, answer the following: 3. What is the total number of students who attended the test? 4. How many students represents the greatest interval? 5. What is the interval represents the smallest number of students?
- Answers: 3) 3+10+16+11+5=453 + 10 + 16 + 11 + 5 = 453+10+16+11+5=45 students | 4) 16 students (interval 20−2920 - 2920−29) | 5) interval 0−90 - 90−9 (3 students).
Third Lesson: Representing Data Using Histograms
- Answers: 3) 3+10+16+11+5=453 + 10 + 16 + 11 + 5 = 453+10+16+11+5=45 students | 4) 16 students (interval 20−2920 - 2920−29) | 5) interval 0−90 - 90−9 (3 students).
-
-
-
-
Classroom Performance:
-
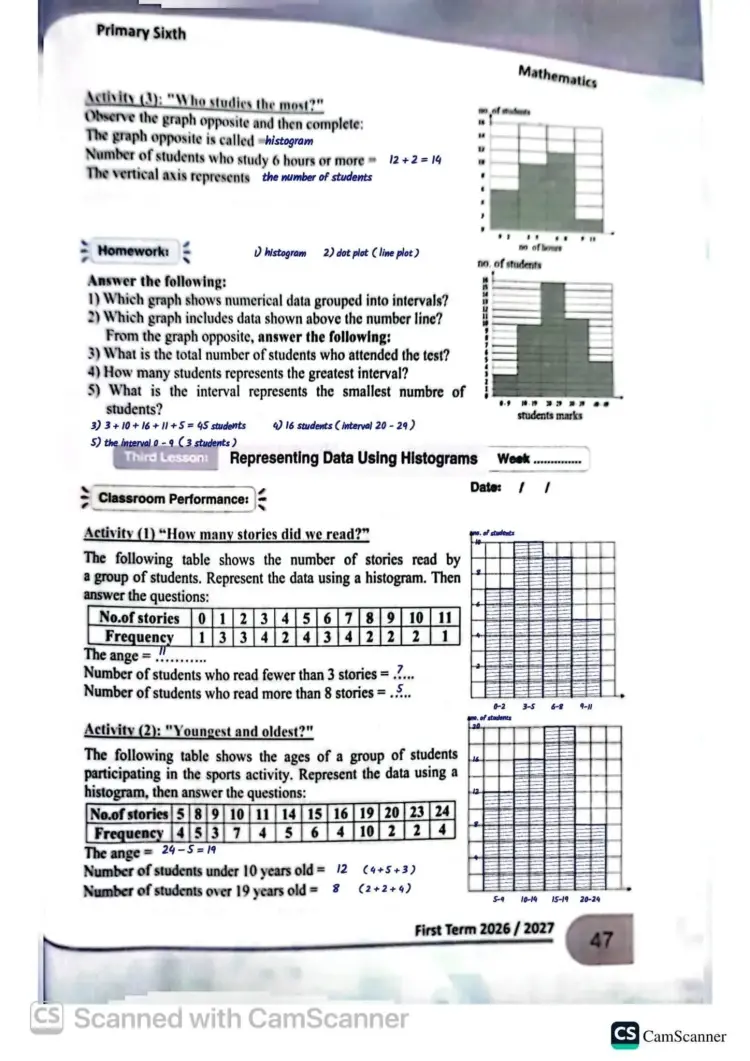
Activity (1) "How many stories did we read?"
-
The following table shows the number of stories read by a group of students. Represent the data using a histogram. Then answer the questions:
-
No. of stories: 0, 1, 2, 3, 4, 5, 6, 7, 8, 9, 10, 11
-
Frequency: 1, 3, 3, 4, 2, 4, 3, 4, 2, 2, 2, 1
-
-
The range = 11−0=1111 - 0 = 1111−0=11
- Number of students who read fewer than 3 stories = ? (1 + 3 + 3 = 7)
Number of students who read more than 8 stories = ? (2 + 2 + 1 = 5)
Activity (2) "Youngest and oldest?"
-
-
-
The following table shows the ages of a group of students participating in the sports activity. Represent the data using a histogram, then answer the questions:
-
No. of stories (ages): 5, 8, 9, 10, 11, 14, 15, 16, 19, 20, 23, 24
-
Frequency: 4, 5, 3, 7, 4, 5, 6, 4, 10, 2, 2, 4
-
- The range = 24−5=1924 - 5 = 1924−5=19
Number of students under 10 years old = 12 (4+5+34 + 5 + 34+5+3)
Number of students over 19 years old = 8 (2+2+42 + 2 + 42+2+4)
Performances and Assessments - Mathematics
-
-
-
-
-
Homework:
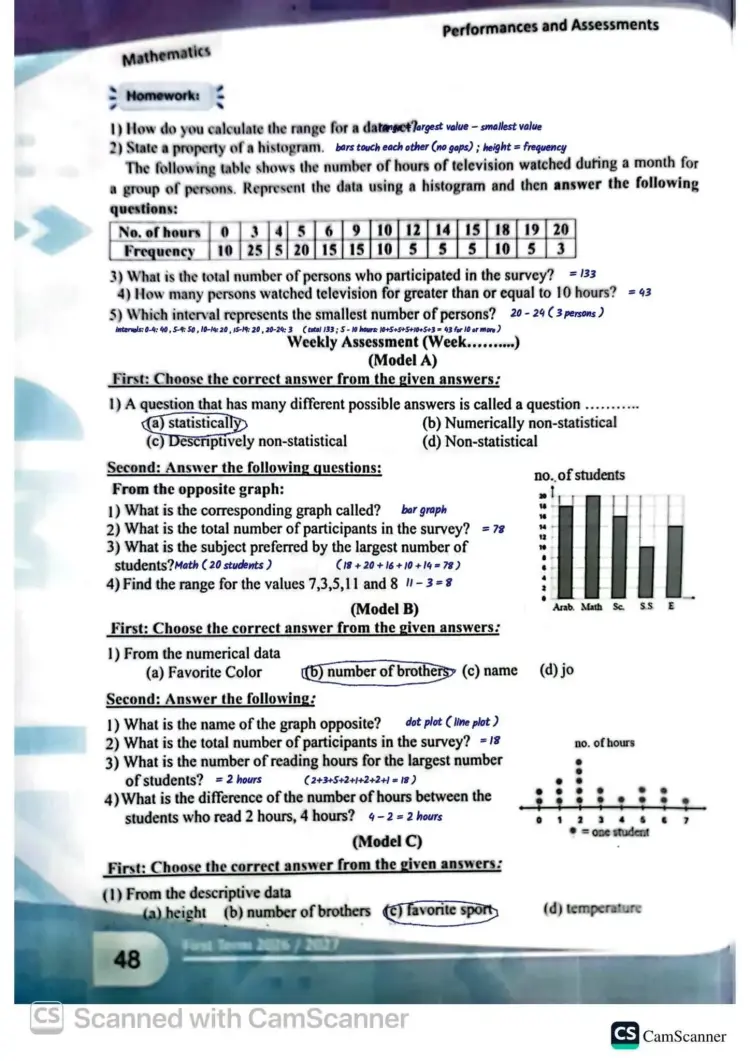
- How do you calculate the range for a data set? largest value - smallest value
State a property of a histogram. bars touch each other (no gaps); height = frequency
The following table shows the number of hours of television watched during a month for a group of persons. Represent the data using a histogram and then answer the following questions:
-
-
No. of hours: 0, 3, 4, 5, 6, 9, 10, 12, 14, 15, 18, 19, 20
-
Frequency: 10, 25, 5, 20, 15, 15, 10, 5, 5, 5, 10, 5, 3
-
- What is the total number of persons who participated in the survey? = 133 (Total 133; 5-10 hours: 10+5+5+10+5+3=4310+5+5+10+5+3 = 4310+5+5+10+5+3=43 for 10 or more)
How many persons watched television for greater than or equal to 10 hours? = 43
Which interval represents the smallest number of persons? 20−2420 - 2420−24 (3 persons)
Weekly Assessment (Week .........) (Model A)
- How do you calculate the range for a data set? largest value - smallest value
-
-
First: Choose the correct answer from the given answers:
-
A question that has many different possible answers is called a question .........
- (a) statistically
(b) Numerically non-statistical
-
(c) Descriptively non-statistical
-
(d) Non-statistical
- (a) statistically
-
-
-
-
-
-
Second: Answer the following questions:
-
From the opposite graph:
- What is the corresponding graph called? bar graph
What is the total number of participants in the survey? = 78 (18+20+16+10+14=7818 + 20 + 16 + 10 + 14 = 7818+20+16+10+14=78)
What is the subject preferred by the largest number of students? Math (20 students)
Find the range for the values 7,3,5,11 and 8: 11−3=811 - 3 = 811−3=8
(Model B)
- What is the corresponding graph called? bar graph
-
-
-
-
First: Choose the correct answer from the given answers:
-
From the numerical data:
-
(a) Favorite Color
- (b) number of brothers
(c) name
-
(d) jo
-
-
-
Second: Answer the following:
- What is the name of the graph opposite? dot plot (line plot)
What is the total number of participants in the survey? = 18
What is the number of reading hours for the largest number of students? = 2 hours (2+3+5+2+1+2+2+1=182 + 3 + 5 + 2 + 1 + 2 + 2 + 1 = 182+3+5+2+1+2+2+1=18)
What is the difference of the number of hours between the students who read 2 hours, 4 hours? 4−2=24 - 2 = 24−2=2 hours
(Model C)
- What is the name of the graph opposite? dot plot (line plot)
-
-
-
First: Choose the correct answer from the given answers:
-
From the descriptive data:
-
(a) height
-
(b) number of brothers
- (c) favorite sport
(d) temperature
-
-
-
-